Jan 28, 2012

End Of Accumulation Phase

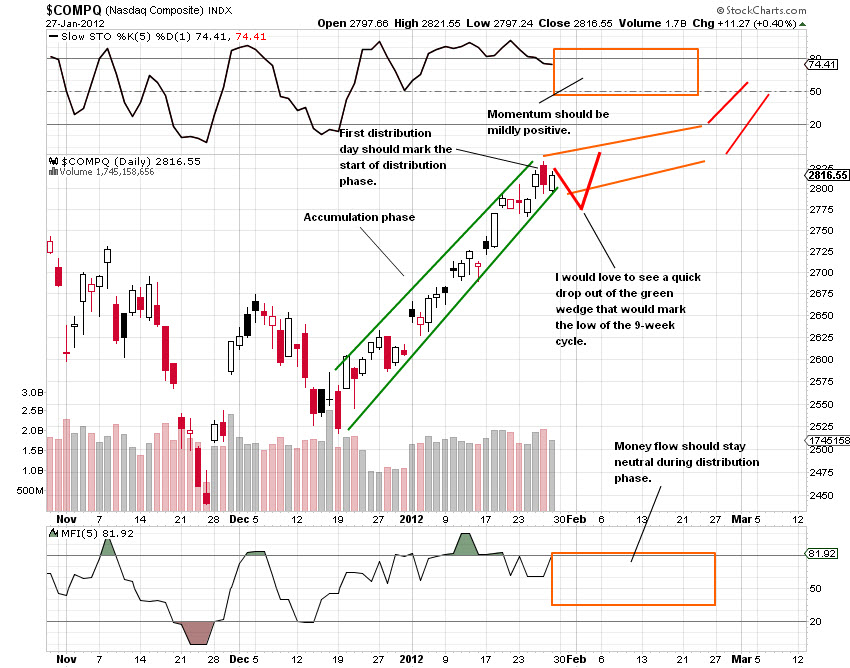
I would like to continue a stock market discussion from the previous week. Stock market is in a runaway move in my opinion. Once again I've prepared three charts from previous runaway moves and marked three distinct phases on each of them. I won't explain each separately. The point is that runaway moves typically start with a long accumulation phase. The slope of this phase is very steep and there are almost no down days. It continues with the distribution phase, when market starts to behave choppier. Momentum is mildly positive and money flow hardly ever gets into overbought readings. This phase is typically shorter from the first, but there have been exceptions. However, there are virtually no exceptions to the final, climax top phase. This is almost always a quick, steep 1 to 3 day breakout that marks the end of the bull market. See charts below for examples.


Let's now extrapolate these findings to the current market. I guess a pretty large distribution day on Thursday could mark the end of accumulation phase. There was no follow through to the downside on Friday, so more downside could take place next week. One thing that still bugs me is that I've completely lost my cycle count. We are on week 9 of the 9-week cycle and thus already overdue. Although I wish for further upside I'd also like to see a quick drop out of the green wedge that would mark the cycle low. Another thing that concerns me is the extreme slope. I speculate that market could now go into distribution phase, followed by climax phase. But this is just this. Speculation. Such an extended move into resistance could very well top right here. We'll have to wait at least another week and see. If indexes dropy in a slow, controlled fashion, there is a high chance of the orange channel to take place. If on the other hand sell off days start to pile in, chances are better for a final top in a week or two.

Jan 21, 2012

Another Climax Run?

The market action has frustrated me for the last two weeks. My analysis of cycles suggested an imminent deeper corrections that has not happened (yet). I believe in times when market seems to oppose logic it is best to try to find a past analogy just to see what can be expected in the near term future. By the way, I've decided to rename my cycles for more clarity. I will name them according to the average length of the cycle. Thus, the 18-day cycle means this is the cycle with an average length of 18 days. For 5-month cycle, average length is 5 months and so on.

So, let's start with the facts that we certainly know. Stock market has been stubbornly griding higher for three weeks without any minor sign of exhaustion. Momentum and money flow indicators go from overbought to more overbought. What can we conclude from this?

The first chart below is from February to May 2010. As we can see conditions back then were pretty similar to today's. The second 18-day cycle out of 5-month cycle bottom was accumulation period when both indicators stayed overbought for a long time. The next cycle was choppier as retails started to chase the rally and smarts selling to them. It all finished with a final blow-off top.

Next chart is from September to November 2010. A similar story. The first 18-day cycle after significant bottom was accumulation period, followed by two more choppier cycles with shallow corrections.

Another example is start of 2011. This one was a little bit different. The accumulation period was not so obvious and it stretched into two 18-day cycles. The rest of the story is pretty much the same. Several shallow corrections all being bought until the final climax run.

Now, let's make some general observations before moving to current conditions. First, notice the obvious separation from accumulation to distribution period. Accumulation period exhibits a very well defined uptrend with almost no pullbacks and all indicators staying in overbougth range for several weeks. During distribution period price action tends to become choppier, momentum line starts to wiggle and MFI barely moves above 80 as every rally is being sold.

Regardless of the cycle count it looks like we have just witnessed accumulation period. Every indicator I look (price/volume, stochastics and MFI) display these properties. Timing wise I am not so sure that 18-day cycle low is already behind us. We are on day 21, which is very late, but the constantly overbought MFI suggests we may still see that 2-3 day pullback before continuation of the uptrend.

Cyclicaly speaking we are in the timing band for a 9-week cycle low and in the timing band for a 18-day cycle low. A 3% drop should probably be enough to satisfy these conditions. On the other hand, the 9-week cycle may easily extend up to 12 weeks, so another 18-day cycle until the 9-week bottom is not out of question. Also, mind that we are officially still in a bear market. The long term 5-month cycle is not so far away and it is simply hard to believe that we may see another month or so of higher prices. But who knows?

I basically see two possibilites right now. The lenght of this rally and money flow suggest a very strong accumulation that should spurt another powerful push higher. On the other hand the parabolic look of this final week may also mean that we may just witness a couple more days of climax run, followed by a plunge. Although I like to make long term projections my trading decisions are (or at least should be) made based on short term market action. Right now markets are way overbought and even if this rally turns out to be a climax run I have no intention to buy anything until I see at least a 2% correction that would release overbought conditions, confirm my initial view that accumulation period is coming to an end and print a clear cycle low, whether it be just 18-day or 9-week cycle. So, currently I'm in a waiting mode until some high pribability setups present.

Jan 19, 2012

Stock Market's Surprise

Stock market has caught me totally unaware. I certainly did not expect such an extended move to the upside. From technical perspective it seems unrational, but I have to proclaim that one day drop down to the previous consolidation area as a 17 day half-daily cycle low. I could also say that we are on day 19 of an extremely extended cycle, but it is usually better to stick to the normal timing bands and day 17 is much more normal than day 23 or more. So, what can we expect with this new cycle count in place? From the half-daily cycle perspective, the cycle is still young and could rally for two more weeks before bottoming. But the daily cycle is 35 days old and already in stage for a bottom. I simply don't believe we may see much more further upside. Not to mention indicators that have resisted overbought levels since the start of this daily cycle. Furthermore, big volume up days late in the cycle often tend to mark tops. We'll just have to wait for a decline to happen and then see how much of further upside we can expect. As it looks now, decline should be quick and shallow, soon followed by by a higher high.


Let's see how gold is doing. Right now, gold is a laggard. It is making higher highs, but volume and momentum suggest another half-daily cycle decline is imminent. If it bottoms above previous low, I might consider a minor position for a short term trade as volume properties still suggest another higher high.

I usually don't talk about gold miners, but there is a high probability shorting setup developing. Miners mostly follow gold in cycle count but are also affected by stock market. They are the weakest issue of all three. While gold and stocks are making higher highs, miners are way below. There is strong divergence in both momentum and volume and day to day candlestick analysis also exhibits selling into every strength. Any rally up to 54 mark would provide a very high risk/reward ratio short setup. It may happen during current or the next half-daily cycle.