Oct 29, 2011

Is Dollar Toast?

For weeks I've been touting that stocks are in a cyclical bear market and that current rally should be short lived, meant just to revert bearish sentiment. My arguments for this case have been a cyclical nature of the stock market, a very obvious five month topping process, lack of real leadership and the fact that bear markets usually don't bottom in just one phase.

But the current four week rally actually gives the appearance of a solid new uptrend. First of all, it has simply gone way too far. Not so much in percentage as in retracement terms. Bear market rally simply should not retrace 70% of the previous drop. Mind that NASDAQ is actually only a couple of percents below the bull market highs. Secondly, with the exception of the lack of a valid follow through day near the bottom, it has been a high quality rally. From the beginning of this uptrend, we have witnessed only one distribution and both two day correction were heavily bought as hammer candles followed by instant breakouts indicate. This Thursday's heavy volume breakout above MA200, the final technical resistance level, siggests something significant may be hapenning under the surface.

Mind that such strong late breakout often lead to reversals as big money sells into buying frenzy. So we still have to be cautious. But Friday's action looks more like consolidation than exhaustion, so I suspect new highs will be reached soon. Of course, sooner or later market will have to go into a more significant correction and the rally out of that correction will give us clues whether this bear actually has bottomed on October 1st or not.


The next very important evidence for the bullish stock market case is the dollar. After rallying sharply out of its three year lows, the buck could not find support during correction and is now on the verge of touching the final support line again. If there is any chance that the dollar continues the uptrend, it should reverse and rally violently above MA200. If that doesn't happen in the next week, chances are high that dollar three year cycle topped in only two months, which means that stock bear market is definitely over and that we won't see a decent correction in gold for the rest of its bull market.


Speaking of gold I think the yellow metal will soon give a stab at the ascending resistance line, which we already draw several times, before going into a brief correction (coinciding with the dollar briefly rallying from oversold conditions). It should then consolidate somewhere above MA50 before resuming the uptrend. If (and only if) the dollar is finally toast, I believe we won't get a decent correction and a buying opportunity in precious metals until the next short term spike which could be several months from now. Not to mention that an extreme parabola could also mean that gold bull is over. But it's way too soon to discuss this.


So, the past week completely reversed my expectations for gold and stocks, but that is the nature of all markets as they always fool the majority. That being said I must also point out that almost ALL bear market corrections look like that! Everytime the market falls far off its highs, a rally which will give the appearance of a high-quality uptrend will be produced. When the last bearish analyst throws in the towel, when bullish sentiment reaches extremes and when "everything is fine again", then is the time when the most dramatic plunges happen. So, let's just stay cautions. Day-to-day based analysis is still the best tool.

Oct 26, 2011

Gold Headed For higher Prices

Well, how things change in the stock market. A couple of days ago I issued a sell signal in gold, anticipating another leg down. But once again gold tagged the 150 MA, rallied weakly for two days up to resistance and instead of turning back down, flashed a very strong accumulation day that sliced through resistance like a hot knife through butter. From my experience, when negative signs give positive results, this is extremely positive (and vice versa). As this is only the beginning of a new daily cycle, which should last for at least a month or so, I believe gold will soon attack the all time highs. I bought a share of silver ETF SIVR to participate in this rally.

Oct 23, 2011

Stock Market Is A "Buy"

I am a bit reluctant to say this, but stock market flashed a buy signal. From the beginning of this rally I've been warning that this is just a normal bear market rally. These often come on surprise, driven by short covering. They usually extend very quickly to an unbuyable overbought areas and they often start on low volume without any strong accumulation on the way up. These are all characteristics of the current rally.


However, even in bear markets, intermediate cycles usually don't top in just three weeks. Most often it will take 6-8 weeks to reverse the bullish sentiment, created by a false rally. At least that is the case in the early stages of a bear, when many people are still optimistic. Anyway, Thursday's dip was obviously bought and now we should get in the stage of "buy the dip, sell the rip" type of action as smart money starts to swing trade, distributing their shares into every break to new highs and not leting prices fall too much. Most breakouts will fail in such market and the best strategy is to buy high quality names as they pullback into support areas and sell them into 10% plus profits. Eventually, as enough weak hands buy these fake breakouts, smart money will stop buying dips, which should pull the rug below market's legs.

Oct 20, 2011

Gold Heading Lower

I think the triangle consolidation in gold I speculated about last week is now finally off the table. Gold is breaking down of feeble three week consolidation and now it should only be a matter of time before the black support line gets broken.

With some benefit of hindsight I can say that the rally has been doomed from the beginning, which I pointed out several times. 13 weeks is way out of normal timing band for intermediate lows and a plunge of that magnitude could not recover that easy. However, I still expected that gold will pullback up to arround 1800, which teased me to buy some SLV. Needles to say I got stopped out. The weakness of this rally indicates that the black support line should finally get violated, which means that gold will have to find new support lower.

If we get back to the September 24 post, when we draw some support lines, we can see that gold should now look for major support on green line at about 1500 and then lower on pink line at 1400. It's impossible to say which one of these lines will hold. My plan is to wait for a tag of 1500 and if price rebound, buy some. If I get stopped out, another buy point is 1400.

All in all, gold is still in a downtrend and in a sell mode as of today.Povezava

Oct 18, 2011

Historical Precedents For Current Rally

Yesterday Dan Zanger, one of the best traders of all times, posted a tweet on Twitter, where he compared October 1998 bottom, which lead to a huge rally, with today's market conditions. Actually, double bottom as we saw a couple of weeks ago, is a quite usual intermediate bottoming pattern. In 1998 Nasdaq bottomed three times this way, as denoted on the chart below. However, I argue that there can be no comparison between 1998 and 2011. In 1998 Nasdaq was in a secular bull market and October bottom was a normal cyclical correction within a larger uptrend, although very deep due to extreme volatility of those times.


Today, stocks are in a secular bear market and 2009-11 rally was a cyclical correction within a larger downtrend. If we were in search for precedents of current conditions, we would have to look inside primary cyclical bear markets. I scanned the last two major bear markets and found three intermediate bottoms that could be compared to today's.

The first rally after Nasdaq climax top in 2000 is probably as close as we can get in search of our precedent. Double bottom after initial drop looks remarkably similar to current. After that Nasdaq rose 25% in just 8 days, but soon finished this run. What followed was 5 weeks of meandering in horizontal channel. Finally, a failed breakout signalled the next leg down in a bear market.


April 2011 bottom could provide another example. After a bottom Nasdaq again shoot out, made everything in 11 days and then stalled for 6 weeks. The bottoming formation is not just quite today's, but the initial rally was similarly powerful.


And a third preccedent is October 2002 low. Bottoming pattern is a nice rounding head and shoulders top with a double bottom again. The rally following it then made 35% in 7 weeks, before rolling over again.


When in search for historical example, we should mainly be concerned with the shape aind not so much with the percentage gains or losses as they vary with general volatility. Also, we should consider the context of the current conditions. The 2002 intermediate low was already deep into the bear market. Also, the rally started with a perfect follow through day, which was not the case in any of other examples, nor is the case in current rally. But both the 2000 and 2001 bottoms could be accounted as valid precedents in my opinion. The bottoming formation in 2001 was a bit different, but the most important is the look-and-feel of the rally out of lows.

If the old proverb, "Markets seldom repeat, but they often rhyme", turns out to have any validity, we should now face around 4-6 weeks of sideways action. A late break out of consolidation is possible, but if it happens, it should be a fakeout. There was never any follow through day, volume was weak from the beginning, most leading stocks have built faulty V-shaped bases and my early buys are acting poorly. Those to me are the main signals that this rally is baloney, meant to fool 90% of traders that bear market is over. I don't buy it.

Oct 16, 2011

How To Spot A Bear Market Bottom, Part 3: 2000-03 Bear Market

This is the third part in the series of posts on how to spot a bear market bottom. In first two parts we examined 2000 and 2007 bull market tops and made a detailed review of the 2007-09 bear market. Now, of course, is the time to take a look at the 2000-03 bear market.

After an incredible bull market starting in 1995 Nasdaq Composite index topped in a spectacular manner in March 2000. 20 % corrections are normal for every bull market, but the 40% drop that happened from March to late May was far from being normal. Chances were that market already topped, but the actual confirmation came 4 months later when market finished its topping process and started breaking down into a pattern of lower-lows and lower-highs. Whoever held positions through the initial drop, expecting that prices will recover (and there were many of these kind), got his nerves tested when prices broke down again. Fortunes were made during 90s technological boom and fortunes were lost in the aftermath. This was a tough lesson for everyone who thought that stocks can only go straigth up.


We'll go step by step through every intermediate term bottom in 2000-03 bear. There were many fake rallies before market actually bottomed in fall 2002. Note that the real bull market rally actually began in March 2003, but the lowest low was made in October 2002. For the larger perspective let's provide the weekly chart of SPX. I'm not going to explain every char into details as they are all annotated, but only point out the main things to consider.


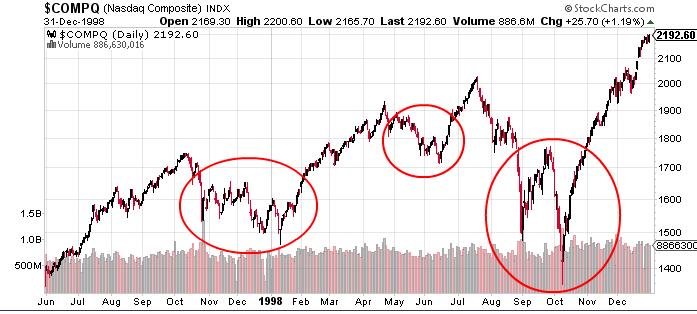
The first rally out of October 2000 intermediate bottom was weak from the beginning. Nasdaq could not rally for more than three straight days before a bunch of selling signalled distribution into a rally. After less than 4 weeks of feeble rally attempt, markets went into new lows.


In early April 2001, after 20% drop, volume increased on a down day and the next day price exploded higher. After two days of consolidation Nasdaq flashed a follow-through day (FTD), which is a big up day on increased volume after a correction. This is a buy signal as markets usually rally at least for a couple of weeks after FTD. However, this was only a second intermediate bottom after a top. A bull market of such magnitude should need much more downside to go. And so, after an initial rally, market starts to act choppy as every rally is met by sellers, eager to get lost of their shares. Two failed breakout attempts are enough to turn buy signal into a sell signal.


The next plunge was devastating as Nasdaq lost more than 35% in about three months. The next sign of bottoming action appeared in September 2001. Markets gapped down and volume increased dramatically on a narrow range candle. It took four more days to actually bottom, but a huge volume suggested that rally out of this bottom could be sustained for more than just a few weeks. Also, at the age of year and a half and 70% drop on Nasdaq, the bear was getting old an chances were that this may be the final bottom. A 9th day FTD confirmed this view. Additionaly, market started the first weeks of rally in a steady uptrend with occasional distribution days, which were immediatelly bought. All in all, without the benefit of hindsight, I would say this is the start of new bull market.


The signs of topping of this intermediate cycle emerged in early December 2001. Nasdaq broke into new highs on huge volume but immediatelly sold off. Now, there is a non-written rule in trading. If market gives us a positive clue (a big volume breakout) but the action is just the opposite (sell-off instead of a rally), these is extremely negative sign. After a classic double top market goes into a correction.


Now, at this point it was everyone's guess whether this is a pullback in an uptrend or a continuation of a bear market. The first argument for the latter case is that this intermediate term rally actually topped with a topping pattern. Intermediate tops in bull market are usually a sudden events that catch everybody by surprise and not an obvious topping process. Secondly, the depth of a correction is concerning. First pullback in a new bull market is usually a short term profit taking event, not taking more than 8-12% of downside to complete. A 19% correction at least signals that the bear might not be finished just yet. A rally attempt soon fizzles out, which is a final confirmation that the three month rally was merely an escape out of severely oversold condition. This case clearly demonstrates why it is so important for a trader to stay nimble no matter how good the market looks. A failed breakout is a signal to stop buying and trim stops. After a double top suspicion trader should be left with only a small part of portfolio invested. And after a confirmed top savvy trader should be in cash, just observing what the market is going to do next.

Anyway, the next stage in bear market was just as ferocious as the previous one. Nasdaq once again plunged almost 50% before next signs of bottoming started to appear. In August 2002 Nasdaq attemped a rally, which was weak from the beginning as there was no volume and no price momentum. Some suspicious FTDs would probably flash a buy signal, but this would be a false alarm.


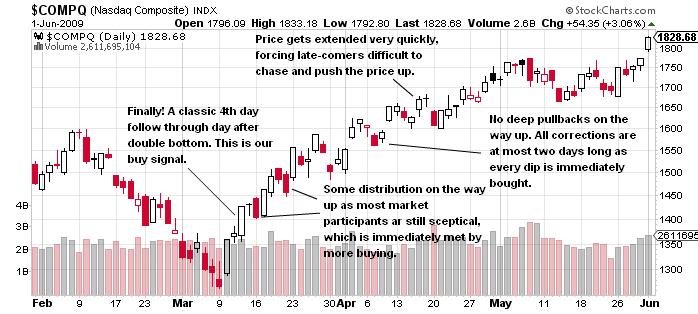
Bear markets like to bottom in double bottom pattern, so every breakdown into new lows that is immediately reversed should be treated with causion. In October 2002 Nasdaq pierced the July lows and pretty soon index could not fall any further as volume increased. An extremely powerful FTD right off the bottom is a buy signal. In less than a week market rallied 10%, catching all shorters off guard. As rally extended further off course many traders thought that this is it. But we have seen this all-too-explosive rallies before and we know that they are often meant just to clear the bearish sentiment out of markets. Too high volatility is never a good sign as this means that too many traders are speculating about short term market action and there are not enough big investors that just stick to their position. This choppines continues in 2003 and bear obviously isn't over yet.


Before I get to the final chart of this rather long post I want to clear what I mean by "start of a new bull market". Bull markets start out of economic conditions that favor a prolongued rally, that can take indices 30-50% higher over a span of 3-5 months. These are conditions when big institutional investors, often referred to as "smart money", are satisified with their positions. They don't sell into the rally but rather support it by buying every single dip, not to let prices fall too much. Obviously, the rally out of October 2002 low was not such case. Deep corrections are a clear sign that bull hasn't started yet.

Now, the October 2002 actually turned out to be the final bear market bottom, but from my point of view the actual bull market started five month later. In March 2003 Nasdaq flashed two consecutive strong accumulation days, which could both be counted as FTDs. Some choppines was following as many traders obviously still weren't convinced that rally will continue. A break out of consolidation in April 2003 is a must-buy signal no matter what. And, finally, in the following weeks the rally acted as it should. A steady uptrend on solid volume and not much price volatility are two major properties of every bull rally. Occasional corrections should not frighten you as they are soon met by more buying. Prices quickly become extended and as soon as everyone figures out that a new bull has started, it is already too late to buy.


The 2000-03 bear market provides some far more important lessons that the 2007-09 bear. First, the is no way anybody could predict when a final bottom is in. The only thing that could be predicted are intermediate bottoms.

The second lessons is that these intermediate bottom should be bought. Why? Well, first, because you can never know whether this is the final bottom. And usually a well-defined FTD, even after intermediate bottom, will provide nice profit potential for the next month or two.

And a third lesson. Stay open to the possibility of a fake rally, no matter how bullish it might seem. And also, never ever go all in. If you are wrong, you can get killed in an instant. The best strategy is to start buying as close to the bottom as possible. Every next buy should be based on the profit of the previous one. As markets rally 20% or more, be cautious. If market gets choppy, stop buying and just observe your positions, how they react after pullbacks and on breakouts. If the rally is for real, you will make a lot of money in the following months even if you are only 50% invested. If the rally is fake, you will be glad you are not 100% invested or even on margin.

However, if spotting a bear market bottom just from the index action is so difficult, can there be a better way to do it? Can we search for additional clues that would give us an edge? The answer is: yes, we can. We'll take a look at this in the next part.

Oct 13, 2011

Gold Still In No Man's Land

I haven't been blogging about gold lately simply because I don't have a clue what yellow metal is up to. Gold obviously found support at the rising trendline, which it successfully tested but acted indecisively since then. A nice rounding bottom pattern even convinced me to buy some SLV in expectation of a snapback rally, but action in precious metals sector in general is feeble.


Anyway, I still believe the most probable scenario for the next month or two is some sort of consolidation inside the channel. Any move below the channel would probably mean much lower prices for gold. A breakout above it would open new posibilites for a continuation of an established uptrend. We'll probably have to wait a few more weeks for confirmation.

Oct 11, 2011

How To Spot A Bear Market Bottom, Part 2: 2007-09 Bear Market

This is a second part in series of posts on how to spot a bear market bottom. In previous part I discussed 2000 and 2007 bull market tops. In this part I will analyze 2007-2009 bear market.

First let's review on weekly SPX chart what happened between October 2007 and March 2009. After topping the market took a year and a half to bottom and SPX lost about 60% during that time. Bear market completed in four distinct phases. During each drop market lost between 10 and 40% while corrective rallies added from 5 to 20%.


Now, the main point of this series is to first show how extremely difficult it might be to spot a bear market bottom correctly. And second, to provide some insights into what tools we might use to catch a new bull market in as early stage as possible. We'll look at every intermediate bottom between October 2007 and March 2009 and search for bear market bottom clues.

The first bottom after initial drop took place in March 2008. Several accumulation days very close to the bottom suggest a new rally might be underway. However, a rally started with wedging, followed by distribution day (DD) immediately. Now, one DD during rally out of intermediate bottom is almost a must and not a critical warning sign on its own. More important is what follows it. A three day pullback was obviously bought as market sported an 11th day follow through day (FTD). Such a late FTD almost always means that rally will be short lived. Following FTD was a 6 week choppy rally with several DDs on the way up and not much momentum in general. Market reversed in June with a technical double top that sent prices to new lows.


The second bottom took place in July 2008. This rally was much weaker than the previous. A failed 7th day FTD is the first sign that rally may not last for long. Price then gyrated in tight range before breaking out, but this breakout turned out to be a bull trap. Without obvious warning signs price just slowly collapsed into new lows.


After an epic plunge during early fall 2008 the first reactive rebound happened in October. Again, at first glance this rally looks quite strong. But the main problem is that reactive rebounds out of extremely oversold conditions are almost always fakeouts as the rally is fueled mostly by short covering. Not surprisingly rally quickly fizzles out into a real intermediate bottom in November 2008.


Now, after 20+ percent drops late in the bear market cycle is when traders should become alert as the probability of final bottom increase dramatically. The rally out of November low is obviously not strong enough to reverse the overall trend. Rally is choppy in general without FTD and momentum and in fact it looks pretty much like the rally out of July 2008 bottom with a fake late rally right before another reversal.

The final bear market bottom occured in March 2009. The most important properties that separate this bottom from all the previous are the following:
  • Rally started with a strong accumulation day off the bottom and a perfect 4th day FTD.
  • Every minor pullback immediately got heavily bought.
  • There was no choppiness as the price progressed in steady uptrend during the first few weeks.
  • Price got extended quickly, leaving latecomers very few chances to jump on board.

As we know now the March 2009 bottom started a two year rally. With the benefit in hindsight spotting the exact bottom might look easy: just search for FTD and buy. But it's far from that. The 2007-09 bear was in fact pretty well-mannered. The first good-looking bottom was actually the final bottom. As we shall see during 2000-2003 bear market analysis this is not always the case. Often perfect FTDs will fail and sometimes market will bottom in a choppy manner when everybody are in doubt about the rally. But that's the way the market works in we traders have to conform to it.

Oct 10, 2011

First Bear Market Rally On Its Way

I think last week we experienced a first intermediate bottom in this bear market. Rallies out of such bottoms tend to last from 4 to 8 weeks, gaining between 10 to 20%. Why I think this rally is for real and not just another fakeout? There are three reasons for this.

First, we have a historical precedent that mimics the current market behavior in frightening details. In March 2000 Nasdaq topped after a spectacular bull run. It then fell almost 40% and made a choppy rally that quickly topped in a head and shoulders pattern. In late May price sliced through the previous lows and everybody thought the end of the world is coming. But instead, index sported a massive accumulation that fueled the rally for 6 weeks, gaining almost 40%.


Now, look at the current situation. After the first real drop from the top all major indices show very similar behavior. A rally from 20% drop topped in a short head and shoulders pattern, undercut previous lows and rallied viciously.


The second positive sign is that Friday was not a distribution day. Any down day on low volume, especially Friday when traders like to liquidate positions, is positive during rallies, even in bear markets.

And the third and most positive sign is that my watch list of top stocks that are completing their bases and are ready to breakout has extended to as many as 10 stocks, which hasn't happened for almost a year now. Trading is a game of probabilities. And the more stocks build their bases, the higher the chance that many breakout will succeed and drive the rally higher.

Now if we can trust historical precedence this uptrend should last for at least 4 weeks and not more than 8. During the first rally in bear market many stocks can still be successful trades and should be traded. Also, the first rally tends to break all technical levels to the upside to draw in as many people as possible and remove early shorters. When distribution is over, it tends to drop without warning, leaving very little room for entry to the short side. We'll get back to this when time is right.

If today's strength holds into close and volume increases from the previous Friday, I'm going to issue a buy signal on stock market.

Oct 7, 2011

How To Spot A Bear Market Bottom, Part 1: Bull Market Top

I decided I'll make a series of posts on how to spot a bear market bottom. When bull markets top a trader has only two choices. He can try to short indices or individual stocks or sit on cash and wait for a bottom. A third option, riding a bear market all the way down is not acceptable and should not be exercised. In any case, spotting a bear market bottom is an opportunity that must not be missed. Markets are made to trick most of people. And most people won't catch an exact bottom. The ones who do, however, will make fortunes in the first and usually most powerful phase of a new bull market.

In this part we shall look at the first stage of a bear market which is a bull market top. The last two major bull market tops occured in 2000 and 2007. Both annotated charts are shown below.


Now, there are a couple of things to notice here. First and most important: a market top is a process, not a one-time event. Major tops take months to develop. 20% corrections are normal occurences and they don't necesserily mean that a new bear market has started. However, deeper corrections might suggest that market has already topped, as happened in Nasdaq 2000 top, which was the special case of a climax top. So shorting too early, anticipating a bear market, might be very bad for your portfolio.

The second thing to notice is that bull market usually tops when, after 15-20% correction, it cannot rally into new highs and keep the breakout. 2007 top is a classic example of this as market made a double top right above the breakout point and then collapsed.

Bear market is confirmed when the pattern of lower lows-lower highs starts to emerge. As long as uptrend line is valid, we cannot be sure that this is really a start of a bear market and not just an intermediate correction.

Now, let's see how this applies to the current market conditions. First, the length of topping process. Both 2000 and 2007 top took almost exactly five months to develop. History often repeats itself and so it did this time. How long did 2011 top take? Exactly five months.

The topping pattern was a classic head-and-shoulders. After marginal breakout to new highs in late April 2011, market soon dropped for another correction, which tested prior lows. After that a fakeout rally formed a right shoulder before neckline finally gave way and a pattern of lower highs-lower lows confirmed the start of a new bear market.

As we shall see in following parts, bear markets don't bottom that easy. It usually takes several fake rallies, which fool majority of traders, before market, when everybody throw in the towel, finally bottoms, leaving most traders behind. The main point of this post is to show some evidence why I think this bear market is far from bottoming. We have only witnessed the first stage after a top, which should be followed by at least two nasty drops. More on bear market stages is following.

Oct 4, 2011

Possible Neutral Signal

Today all major indices gapped down rigth below August lows and rallied violently since then. It looks like at least short term reversal is due. If strength holds into the close a neutral signal will be generated. Since I don't believe this is the final bottom before a longer rally, I will be looking for another shorting opportunity at MA50. However, we must stay flexible in case rally turns out to be strong. I also closed my SDS (2x inverse SPY ETF) long postition today an hour after open with a 15% profit.

Oct 1, 2011

When Will This Bear Market End?

Just want to share a couble of charts with you today about my long term view for the stock market.

After 20% drop stocks have been unable to rally. After a 10% weak rebound rally June lows are now jeopardized. I must say this is typical bear market action. In charts below you can see phases of last two major bear markets, the 2007-2009 and 2000-2003. The first thing to notice is that bear markets tend to have at least three, but usually 4 and sometimes even 5 downside moves. Most of these plunges fall into the 15-30% category. Usually the third or fourth drop is the most destructive, when market may loose 40% or more in a matter of weeks. Fortunatelly such crashes usually mark the start of new accumulation and late stages of bear market.


The next thing to point out is that bear markets tend to last from a year to 2.5 years, depending of the number of bear market cycles and strength of the previous bull market rally. The 2000-2002 bear, following incredible 5 year, 250% bull market rally, lasted about 2.5 years and lost 50%. The 2007-2009 bear market, following 5 year, 100% bull, lasted a year and a half, loosing around 60%.

The 2009-2011 bull market was rather short. In little more than 2 years S&P got 100%. Bear markets usually loose about 50% and so should this one. A more important question is how long will it last? My best guess is that it should be one of shorter duration, presumably between a year and year and a half. Why? Well, first of all, previous bull-bear market cycle was unusually long, spanning more than 6 years. I guess this one should be shorter to "catch up" the usual 3-5 years trough-to-trough rule.

Second, all that's been happening for the last 10 years is a consequence of a secular bull market that topped in 2000. The secular bear is ready to bottom. Quick bulls should also end quickly. After only two years of rising prices, this cyclical bear should bottom pretty soon. And if the economic timing at the bottom is right, we should be witnessing the start of new secular bull market starting a couple of years from now.