Today, stocks are in a secular bear market and 2009-11 rally was a cyclical correction within a larger downtrend. If we were in search for precedents of current conditions, we would have to look inside primary cyclical bear markets. I scanned the last two major bear markets and found three intermediate bottoms that could be compared to today's.
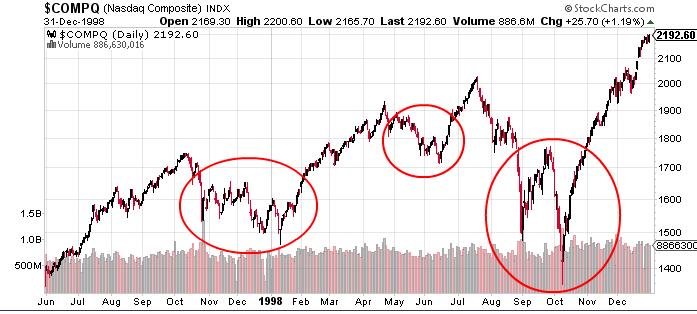
The first rally after Nasdaq climax top in 2000 is probably as close as we can get in search of our precedent. Double bottom after initial drop looks remarkably similar to current. After that Nasdaq rose 25% in just 8 days, but soon finished this run. What followed was 5 weeks of meandering in horizontal channel. Finally, a failed breakout signalled the next leg down in a bear market.

April 2011 bottom could provide another example. After a bottom Nasdaq again shoot out, made everything in 11 days and then stalled for 6 weeks. The bottoming formation is not just quite today's, but the initial rally was similarly powerful.

And a third preccedent is October 2002 low. Bottoming pattern is a nice rounding head and shoulders top with a double bottom again. The rally following it then made 35% in 7 weeks, before rolling over again.

When in search for historical example, we should mainly be concerned with the shape aind not so much with the percentage gains or losses as they vary with general volatility. Also, we should consider the context of the current conditions. The 2002 intermediate low was already deep into the bear market. Also, the rally started with a perfect follow through day, which was not the case in any of other examples, nor is the case in current rally. But both the 2000 and 2001 bottoms could be accounted as valid precedents in my opinion. The bottoming formation in 2001 was a bit different, but the most important is the look-and-feel of the rally out of lows.
If the old proverb, "Markets seldom repeat, but they often rhyme", turns out to have any validity, we should now face around 4-6 weeks of sideways action. A late break out of consolidation is possible, but if it happens, it should be a fakeout. There was never any follow through day, volume was weak from the beginning, most leading stocks have built faulty V-shaped bases and my early buys are acting poorly. Those to me are the main signals that this rally is baloney, meant to fool 90% of traders that bear market is over. I don't buy it.

No comments:
Post a Comment