Nov 29, 2011

A Reflex Rally

A brief update on the recent action in stocks and gold.

Yesterday stock market indices completed a strong swing low, which is a clear indication that a new short term uptrend has started. I want to stress SHORT TERM as I fully expect the current cycle will top sometime in December. I'm not sure whether we may start making lower lows this year, but January 2012 should be a strong down month. Anyway, stock market is now on neutral signal and I doubt we will get a decent buy signal before spring 2012.


Hard to say what gold is up to. It completed a swing low yesterday also, but today's lack of follow through suggests the current cycle should top below the recent, which means that lower prices may be ahead. We're still waiting for the break of the descending trendline or MA150. A break that should determine gold's trajectory for another quarter or so.

Nov 26, 2011

On Time For A Bounce

This week made nothing more than confirm my views from the week ago. Stocks dropped from the bearish topping pattern and should now face some sort of a bounce from oversold levels. The 2600 area on Nasdaq looks like a good spot to look for shorting opportunities. The MA200 now finally and completely turned down. Past analysis that I've made some time ago revealed that when MA200 changes its course, this usually means a long term trend reversal. From my point of view, we are now in a confirmed bear market. What does this mean? It means that every rally should be very choppy and short lived. The tendence to go is now on the downside and so should be our trading strategies. It is still pretty early in an intermediate cycle. Current cycle bottomed seven weeks ago. Cycles in bear market tend to be of a bit shorter duration, but we should see at least ten more weeks of generally lower prices. Only when this cycle bottoms, I will start looking for possible longs.


Gold action is still a bit unclear. On first glance the triangle consolidation looks bullish, but frankly, I don't think gold is going to break out. If stocks are in a bear market and dollar in an intermediate cycle rally, it simply doesn't make any sense for gold to breakout and rally above 2000. But markets often don't make sense, so I'll refrain from any speculation about the direction of the breakout until it really happens.


Even if gold breaks to the downside I have no intention whatsoever to short and precious metals index or stock. If I learned anything in the past two years is to buy bull markets only and short bear markets only. So, my strategy for the next couple of weeks is to try to catch a short term top in stocks and IF gold triangle breaks to the the upside, buy a position in precious metals. Just in case this turns out to be the last obvious consolidation area before the final climax run.

Nov 19, 2011

A Test Of October Lows?

Finally, a "bullish triangle" pattern forming on SPX broke to the downside. First, I'd like to say a word about patterns on stock market indices. The simple fact is that in most cases they are completely irrelevant. SPX index is a weighted sum of 500 stocks and any triangle, cup with handle, double bottom or any other pattern formed on such an index is more of a coincidence. It's usually much better to follow the accumulation-distribution pattern which has been strongly in favor of bears recently.

Anyway, I'm almost certain that the first intermediate bear market rally has topped and we should be facing gradually lower prices for at least another 3 months. The first downside target is around 1125 on SPX, where buyers came in during the first decline. In anticipation of these levels I opened an SDS long position (2x inverse SPX). Although I don't believe the October lows will hold for long also, I don't want to make any bold predictions until my first target is met. Any minor rally from current levels early next week should provide an excellent opportunity to open some additional short positions in my opinion.

As seen from the SPX chart above my market direction system has been pretty solid in the past few months. Although it produced several consecutive signals in a very short period of time, which is not desired, it has generally kept me on the right side of the market. I'm especially confident of the last sell signal as these kind of "sell-off - wedging rally" topping patterns have proved as extremely reliable in the past. Also, a triangle on SPX turns out to look like a head and shoulders topping pattern on COMP, which is another strong distribution sign.

I've been talking about the possible triangle formation forming on gold for quite some time. If this turns to be the case I think precious metals are in for a monster rally in 2012. If, on the other hand, gold breaks below MA150, which was a strong support for 2 years, I believe we'll have to draw another support below the September low. Which is quite possible as it better coincides with the anticipated stock market low in early spring 2012. It is still too early to say anything in particular, though. Right now, gold is on a sell signal and should be headed for a corretion.

Nov 10, 2011

On The Verge Of Next Leg Down In Bear Market

I think the past two weeks now clearly resolved the issue whether stock market wants to reach new highs or resume its bear market trend. The good-looking rally above MA200 was nothing more than a fake breakout, a classic for bear market tops. As I always say, any positive sign that is reversed, should be treated as double-bearish. Breakout failed, sported a distribution day, then market rallied for a week, before another big sell-off day kicked in. It now looks like indices are drawing some sort of triangle pattern, which in my opinion will break to the downside. Actually, any rally into MA200 or upper triangle line should be an excelent shorting opportunity. We'll look at a bigger picture of when and where this intermediate cycle should bottom when we get a confirmation that the next leg down is underway.


The main reason for weakness in stocks is the dollar, which rallied viciously above MA200. Actually, I believe that dollar should now enter a steep uptrend that should last at least three months and push stocks into new low ground.


Regarding gold, I don't believe that any commodity market will be able to rally in face of a strong dollar. I'm not sure whether gold will go below September's low or not, but I'm almost certain that the current rally is now over and that precious metals in general should be headed for another correction.


I think the following months will rip the stock market apart. I wouldn't be surprised if indices traded 30-40% lower two or three months from now. For quite some time I wasn't sure if the dollar is going to break down and push stocks and gold higher, or it will reverse and lead the next leg down in bear market in stocks. I'm quite glad that things finally crystalized as I expected from the beginning. From now on stocks and gold are on a SELL signal and any rally in stocks should be an opportunity to open some short positions.

Nov 3, 2011

How To Spot A Bear Market Bottom, Part 4: Look At Stocks For Clues

This is the last part of a series of posts on how to spot a bear market bottom. If there is one thing clear from the first three parts it should be that spotting an exact bottom of a bear market is at least very, very difficult if not impossible. The 2000-03 bear market provides plenty of examples of how a good-looking rally can quickly fail and drive the next leg down. But, the fact is that indices show only a part of the story. It is a market of stocks after all and general market conditions could as well be judged by the state of individual stocks.

Amazon (AMZN) was one of those stocks that were big leaders after the market bottom in 2003. In fact, Amazon bottomed almost 10 months before the general market and during the last few weeks of final sell-off in general indices, AMZN formed a very constructive pennant pattern, which was perfectly buyable. As the market tested the lows again in March 2003, AMZN was holding up well, building another base that showed its superior strength during that time.

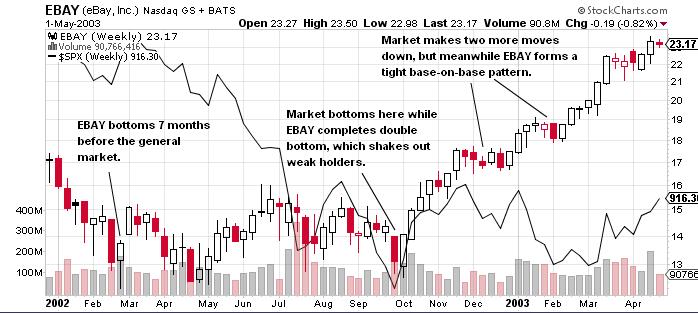
E-Bay (EBAY) is another good example of a high relative strength stock, which turned out to be a bull market leader. It bottomed seven months before a general market and completed a constructive double bottom base and exploded higher together with the market. EBAY's leadership quality became even more apparent in weeks ahead as it formed two tight channel bases that are almost always a sign of extreme strength.


Yahoo (YHOO) was a bit different story. It bottomed together with the market in a selling climax, but the doubled in less than two months, kept the high relative strength during correction and broke out to new highs again when the pressure from the market was released.

Taser (TASR) is an example of a pennystock that literally exploded when the market started rising. From the breakout point to the climax top TASR made almost 10000% to those who were patient and brave enough to hold such a volatile stock.

There are plenty of examples of how stocks build buyable bases during last stages of a bear market also from the 2007-09 bear. Leaders of past bull cycles usually don't lead the next, but Amazon was an exception. Again, it bottomed way ahead of the market and built a constructive tight channel during the last selling climax.


Baidu (BIDU) is an example of a stock that doesn't fall with the last stages of a bear, nor does it make any significant progress, but simply builds a base while everything is going down. BIDU was a difficult buy as it did not breakout on any significant volume and price increase, but nevertheless it was one of top stocks of the 2009-2010.


Chipotle Mexican Grill (CMG), a fast-food franchise, surprised just about everyone during the past bull cycle. However, if we look at CMG during 2009 bottom, it is clear that something was brewing under the surface of a just-another-fast-food-franchise at that time. CMG's base is not the best looking in the world but the fact that it was 25% above lows while everything else was making new lows, is a sign of superb relative strength, which took stock up to the 350's area in the following two years.


The last stock we are going to look at is Netflix (NFLX), a superstar of the past bull. NFLX was one of those stocks that are almost impossible to grab a share of as they start their magnificent run way before the market turn. As the bear market bottomed NFLX was already 100% profitable to those that bought at exact lows. Of course, no sane person would buy such an extended stock, but NFLX finally tagged the $300 mark.


The point of this post was simply to show on some charts how bear market bottoms are actually made. It is not a one-day event when big institutional investors simply decide that they will buy every stock available, but a process, brewing under the surface several months before a final bottom. The most promising stocks will bottom ahead of the market and build constructive bases during the last shakeout. And when the number of such high-quality bases starts to increase week after week, this is by far the most reliable sign that bear market bottom may be just around the corner. Don't miss it.

Nov 1, 2011

Markets Taking A Breather

Yesterday's powerful rally in the dollar suggests at least a short term low has been printed, which means stocks could take a couple of days to consolidate huge gains made in October. Actually, dollar and stocks have been in perfect inverse correlation for the last two months and if trend is to be continued, the fate of the stock market fully depends on the dollar. As the buck is now severely oversold I expect it will break the descending resistance trendline and rally for at least a week. It might even go to new highs, which should drive the next leg down in bear market for stocks. However, if it turns out that the dollar truly is as weak as ti looks, it would turn around quickly, which should push the stock market even higher. Anyway, two consecutive down days that were not bought and a possible trend reversal on USD suggest a stock market may see some weakness ahead. It is on neutral signal from now on.


What does this mean for precious metals? Not much, I think. Gold has been pretty resiliant to the yesterday's huge rally in the dollar and it looks like it wants to beat its own drum. The cycle is still young, the volume on this correction has been low and I expect gold will at least fill the gap at about 174 on GLD. Yesterday's narrow range trading even convinced me to buy some shares of DGP (double gold ETF) as addition to SIVR (silver ETF). However, when and if the gap gets filled, I'll probably just take the profits without hesitation as there is just too much overhead resistance in the 175-180 range on GLD.