Mar 8, 2012
Closing the blog
I'm working full time, trading part time and writing two blogs. Due to the constant lack of time and motivation to write quality posts I'm closing this blog. My fellow Slovenians can follow me on slotrade.blogspot.com from now on.
Mar 4, 2012
What Happened To Gold?
Please review this post for better understanding of the following Nasdaq chart. Basically I still think there is a very high chance that market finishes this bull run with a climax run. It just follows the script I discussed in January perfectly. The uptrend is still intact and there was no big drop after several distribution days. If there will be a breakout above the red resistance, it will be a climax top and should be sold.

What happened with gold on Wednesday is beyond my comprehension. I don't even want to debate around precious metals too much right now. Plain and simple, after a sell-off of this magnitude, I'm not even touching gold until I become sure again that gold is in a buy zone. Even if by any chance gold rallies up to recent highs, I'm pretty sure it will be sold once again. So, just stay away from gold. We have to wait for another long term for for safer buy spot.


What happened with gold on Wednesday is beyond my comprehension. I don't even want to debate around precious metals too much right now. Plain and simple, after a sell-off of this magnitude, I'm not even touching gold until I become sure again that gold is in a buy zone. Even if by any chance gold rallies up to recent highs, I'm pretty sure it will be sold once again. So, just stay away from gold. We have to wait for another long term for for safer buy spot.

Feb 22, 2012
Lowering Expectations
Let's make a brief market analysis. The Nasdaq Composite still looks pretty good, but there are several indictions that a deeper correction is right behind the corner. Distribution days are showing op on daily charts of all indexes. We already have a failed breakout which is a sign of selling into strength. Cyclically speaking stock market's short term cycle is 16 days old and should deep down into low in 2 to 5 days. I expect this low will be quite deep and the next short term cycle will not make a new high, but instead complete a bit shorter intermediate term cycle, before rallying into new highs again.

One very important suggestion comes from small caps. I follow SML index, which tracks 600 small caps. These have clear laggards in last two weeks. While Nasdaq broke to new highs, SML was being caught in a correction already. And when dynamic small caps are left behind, this is usually a very bad sign for general market also. Both my indicators, the stochastics and MFI also suggest a deeper correction is coming in small caps, which are my primary trading vehicle. Not mentioning a plethora of failed breakouts I've seen lately all across the board.

Stock traders should now lower their expectations a little bit. Personally, I'll take the following steps that should keep me out of trouble:
Gold is acting exactly as expected after an intermediate term low has been left behind. Yesterday's decisive move out of 33 days long cycle was followed by today's follow through, which of course is a sign of strength. Now, what do I expect of gold in the next couple of weeks? First it will have to face resistance at 175 on GLD. I fully expect it will get broken and then the next resistance is all time highs at 185 on GLD. I don't care whether if it gets broken on the first try or not as I will look to sell my stake around 180. When GLD reaches 180 and possibly 185 the usual 25-week cycle will already be very extended and any tag of new highs will probably be met by a bunch of sellers. For now I'm just holding my positions in DGP and GDX and will look to sell sometimes in the second 8-day cycle if everything goes as planned.


One very important suggestion comes from small caps. I follow SML index, which tracks 600 small caps. These have clear laggards in last two weeks. While Nasdaq broke to new highs, SML was being caught in a correction already. And when dynamic small caps are left behind, this is usually a very bad sign for general market also. Both my indicators, the stochastics and MFI also suggest a deeper correction is coming in small caps, which are my primary trading vehicle. Not mentioning a plethora of failed breakouts I've seen lately all across the board.

Stock traders should now lower their expectations a little bit. Personally, I'll take the following steps that should keep me out of trouble:
- Trade only the best of the best patterns.
- Keeping tighter stops on open positions.
- Taking less risk on initial positions.
- Selling half at 50% of my usual profit target.
- Trailing the rest of position with a tight stop.
- Not holding more than 50% of any position overnight to avoid being hurt by big gaps down in market.
Gold is acting exactly as expected after an intermediate term low has been left behind. Yesterday's decisive move out of 33 days long cycle was followed by today's follow through, which of course is a sign of strength. Now, what do I expect of gold in the next couple of weeks? First it will have to face resistance at 175 on GLD. I fully expect it will get broken and then the next resistance is all time highs at 185 on GLD. I don't care whether if it gets broken on the first try or not as I will look to sell my stake around 180. When GLD reaches 180 and possibly 185 the usual 25-week cycle will already be very extended and any tag of new highs will probably be met by a bunch of sellers. For now I'm just holding my positions in DGP and GDX and will look to sell sometimes in the second 8-day cycle if everything goes as planned.

Feb 18, 2012
Stocks Down, Gold Up
From my experience cycles can be a pretty useful tool in choppy markets, but during uptrends they can become a little bit difficult to interprete because all correction are so shallow. During last month I pretty much ignored cycle counts, but now it may be time to review them again to gain a better perspective of where we are.
Cycles for stock market are best seen on SPX. I believe the usual 9-week cycle already bottomed, which is denoted with the blue arrow. We should now be on day 14 of a shorter cycle that usually takes about 18 days to bottom. Both indicators that I use, stochastics for momentum and MFI for money flow, show a divergence from price. Distribution days have finally started to show up. Furthermore, in the last few days I saw some strange brief selloffs in highly liquid stocks. And, most importantly, I haven't had a strong breakout in my stocks in the past week. To sum up, I believe a deeper correction now really is coming. I think Thursday's breakout was fake to attract public into buying.

Another bearish signal comes from Nasdaq. This index has become a laggard again. When Dow and SPX outperform Nasdaq, this is a bad sign for momentum traders and general market as well. I expect Nasdaq to correct the most.

So, if money is flowing out of stocks, where can it go? There is only one logical place, which of course is gold. I firmly believe that Thursday marked a bottom of an intermediate cycle that usually takes about 25 days to complete. With 33 days it was a bit extended, but this is normal and actually positive, because it suggests a longer buying period. Besides, dollar tried to rally a little bit, which stopped gold for a few days. But all my signals suggest gold should rally from here. Momentum has not accelerated to the downside, money flow stayed strongly above 20 line and volume nicely subsided. I think gold is ready to launch higher, so I'm giving a buy signal on it.

Feb 16, 2012
Climax Top In Apple?
Excuse me for not blogging for almost two weeks, but I've been very busy trading and analysing charts. Besides, nothing really spectacular happened in any market anyway.
Today I'd like to say a word or two about Apple. With a market capitalization of over 460 billion dollars Apple is the biggest stock on the planet right now. It represents a huge portion of both S&P ans Nasdaq index and it is on the eye of every portfolio manager in the world. What I'm trying to say is that as long as Apple is going up, stock market will go up. When Apple tops, market will top together with it.
Now, has Apple already topped indeed? Many traders on their blogs and Twitter are fairly convinced that yesterday's reversal was a climax top. It may be, but I think chances are better that we will see at least one more leg up after brief consolidation. Besides AAPL chart I have two charts to show you to backup my words. First is Google that climax topped in 2007. GOOG made a very similar pattern to AAPL's. A breakout was followed by a straight line up. After couple of days of consolidating price exploded higher once again, before breaking down for good.
 The second chart is last year's top in silver as many of us still remember very well. Silver developed a two-stage top. The second stage also made a brief midpoint consolidation before another leg up and final collapse.
 And now let's see how AAPL looks like today. A very similar situation indeed. I consider a gap up on earnings as breakout. And yesterday's big volume reversal candle as merely a start of midpoint consolidation that should not take more than just a few days to complete. After that AAPL may see 700 plus in a month or so.
 I'm not saying this will happen exactly as drawn on the chart, but historical precedents suggest another leg up is very likely. I would not touch AAPL at this stage, though. Every big portfolio manager in the world owns at least a portion of this stock and will use any strength to unload his stakes at a profit. AAPL is strictly an institutional stock and cannot be traded. It also cannot top in one day, so let's see how it develops.
Feb 5, 2012
Correction Should Start Soon
I'd like to make a brief update on stock market. It looks like there will be no extended distribution phase as I suspected for some time. I think chances are now better that indexes are already in the final climax top phase, that should end this 9-week cycle and easy-money period.
I don't bother too much with cycles at the moment as these became irrelevant in runaway moves. I don't believe 9-week cycle low is already behind us. The correction simply hasn't been severe enough. As I've said before the 9-week cycle can easily extend into 11 or 12 weeks, so there is still plenty of time for a deeper correction.
 I like to use historical charts to get an idea of what markets may do in the near term future. I think November 2010 could be used as a proxy for current conditions. As seen on chart below SPX broke out from a tight range base on huge volume up day that stalled on the second day, and then experienced a 5% correction. I don't expect the very same thing to happen now (markets never repeat themselves exactly), but I do expect that correction will start in a couple of days. I believe many traders will see this breakout to new highs as a new buy opportunity, but public is always wrong on the market. This time it should be no different. Currently I still hold two minor positions. If we get any further strength on Monday they will probably be sold.
Feb 4, 2012
Trade Review: STMP, FSL, HSOL, ACHN, EPOC, CONN, FBN, MDVN
As the market went into a runaway move my trading became so intense that it became for me impossible to write trade reviews. With friday's short term climax top (supposedly) I sold most of my positions and now I'm only about 15% invested, waiting for a correction. In this post I'll discuss some of the most interesting trades of the past month, namely the ones that provide some sort of a lesson for me.
STMP
STMP is a stock I've been folloving from November 2011, waiting for an opportunity to enter on a pullback. I patiently waited for consolidation below MA50. As you can see stock even tried to break above MA50 once, but I did not buy because the volume was low and I correctly estimated that this was a fake breakout. The second breakout was on high volume. A scenario I was waiting for more than two months. But I did not buy, because I thought the market was topping. Back then I havenpt realized yet the we are in a new uptrend. It was painful to watch a 20% move, so I entered on a breakout above that minor flag right below the previous top. Which of course was a mistake. I really regret this trade because I was right about STMP all along. But I shouldn't have bought after 20% move right below the resistance.

FSL
FSL was a bit risky and unfortunate trade. I bought breakout above 16 and stock made an ugly intraday reversal. The next day it reversed again on a down day and then finally rallied. This stock likes to close off the highs, which makes it difficult to trade. I think I'll have to skip similar ones in the future.

What follows frome here are several stocks I sold too early.
HSOL
HSOL is a nice example of a launch pattern. I decide to review it due to two mistakes that I made. First, the pattern doesn't look very constructive. There are too many big volume down days in the flag. And second, once I got into the trade I sold it too early on an intraday pullback. In fact, stock has consolidated nicely and set for a breakout above 2, which is the opportunity I should've wait for all along.

ACHN
Another example of scared-out trade. I hate intraday reversals, so I sold a minor profit and then watch the stock rally 20%.

EPOC
Same story here. I caught pullback perfectly, but trailed to tight stop and got shaken out on a day of weakness.

CONN
This is just an example of a perfect pattern that failed anyway. CONN made an excellent cup with handle-with-handle, which should be very bullish. Volime on breakout was huge, so I obviously had high expectations with this one. Well, it failed the very next day. This is why you have to use stops all the time. Even perfect patterns fail!

But all wasn't bad. The following two trades were the most profitable ones in the past month.
FBN
I bought FBN on a breakout above 1.50 and sold a little above 1.80, which made me near 20% in a day. Stock then actually consolidated and rallied even more, but 20% one day gains on penny stocks have to be taken, because these highly volatile monsters can easily turn a perfect trade into a disaster.

MDVN
MDVN was a lucky 30% gainer. I bought the reversal at 50 and soon after stock made a 20% overnight gap up. I entered that day with a 4% trailing stop. Luckily I didn't get shaken out on morning selling. After the stock rallied into the 70's I set a 2% trailing stop which got me out a little below 70. A nice example of good usage of trailing stops.

Apart from these mistakes January 2012 was still one of the best months I've had in two years. Let's conlude with the lessons learned:
- STMP taught me how important is to stay objective on the market. If I hadn't been so sure about the market topping, I would've got this one (and probably many other). First follow stocks, then the market.
- Never follow public opinion! Through the whole uptrend most market analysts, even ones I have a high respect for, were dead bearish on the market and now behave like idiots, sitting on their miserable short positions and claiming that "market is irrational". Again, first follow stock, then the market! Don't follow the herd, which market gurus are a part of. Stocks are always right on time, general market is always late and public is always wrong, no matter what.
- Have initial stops in place all the time and never remove them, but don't sell stock on every minor weakness, especially if the market is strong. Start to trail only when stock reaches a percentage gain that you would not want to give away under any circumstance.
- Sell when you have a one day unexpexted profit. Most stocks reverse after strong up days and barely ever reach previous highs.
Feb 1, 2012
Following The Plan
It seems like today we will get another strong up day in the stock market. Again, it is getting very, very late in the 9-week cycle, momentum and money flow readings are still flirting with overbought areas and many high quality stocks are extended from their buy points. The general picture is still excellent. I haven't seen such a strong accumulation for about a year. But in the short term market will have to correct 3 to 5% if there is any more upside to come. I think what we are seing today in Nasdaq and hopefully tomorrow in SPX is a short term climax top that shall end the accumulation phase. Nasdaq is at new highs, but technically I give more credence to SPX, which is close to testing last week's high. We had a very nice run in the past month, but now is the time to take some off, especially in high octane names that can get killed during a correction. I'm trigerring a neutral signal on the stock market.


The same applies for gold, which is even more overbought as stocks. Of course, this is a sign of long term strength, but right now I think gold may correct more, somewhere between 5 and 8%, before starting another leg higher. If anyone is thinking about buying gold right now... Good luck. Gold is also on neutral signal. We have to wait for a low risk entry once this extreme sentiment chills out a little bit.


The same applies for gold, which is even more overbought as stocks. Of course, this is a sign of long term strength, but right now I think gold may correct more, somewhere between 5 and 8%, before starting another leg higher. If anyone is thinking about buying gold right now... Good luck. Gold is also on neutral signal. We have to wait for a low risk entry once this extreme sentiment chills out a little bit.

Jan 28, 2012
End Of Accumulation Phase
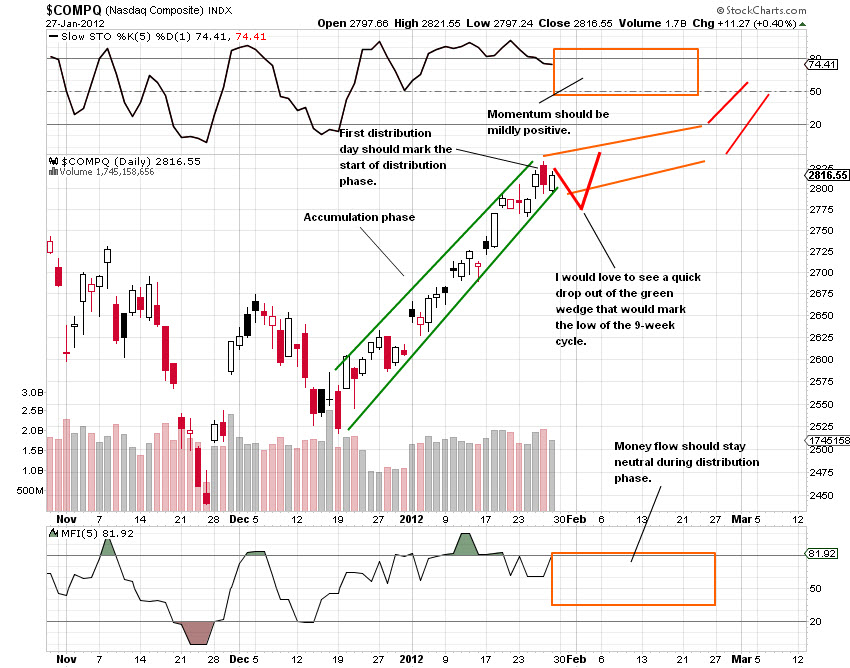
I would like to continue a stock market discussion from the previous week. Stock market is in a runaway move in my opinion. Once again I've prepared three charts from previous runaway moves and marked three distinct phases on each of them. I won't explain each separately. The point is that runaway moves typically start with a long accumulation phase. The slope of this phase is very steep and there are almost no down days. It continues with the distribution phase, when market starts to behave choppier. Momentum is mildly positive and money flow hardly ever gets into overbought readings. This phase is typically shorter from the first, but there have been exceptions. However, there are virtually no exceptions to the final, climax top phase. This is almost always a quick, steep 1 to 3 day breakout that marks the end of the bull market. See charts below for examples.


Let's now extrapolate these findings to the current market. I guess a pretty large distribution day on Thursday could mark the end of accumulation phase. There was no follow through to the downside on Friday, so more downside could take place next week. One thing that still bugs me is that I've completely lost my cycle count. We are on week 9 of the 9-week cycle and thus already overdue. Although I wish for further upside I'd also like to see a quick drop out of the green wedge that would mark the cycle low. Another thing that concerns me is the extreme slope. I speculate that market could now go into distribution phase, followed by climax phase. But this is just this. Speculation. Such an extended move into resistance could very well top right here. We'll have to wait at least another week and see. If indexes dropy in a slow, controlled fashion, there is a high chance of the orange channel to take place. If on the other hand sell off days start to pile in, chances are better for a final top in a week or two.


Let's now extrapolate these findings to the current market. I guess a pretty large distribution day on Thursday could mark the end of accumulation phase. There was no follow through to the downside on Friday, so more downside could take place next week. One thing that still bugs me is that I've completely lost my cycle count. We are on week 9 of the 9-week cycle and thus already overdue. Although I wish for further upside I'd also like to see a quick drop out of the green wedge that would mark the cycle low. Another thing that concerns me is the extreme slope. I speculate that market could now go into distribution phase, followed by climax phase. But this is just this. Speculation. Such an extended move into resistance could very well top right here. We'll have to wait at least another week and see. If indexes dropy in a slow, controlled fashion, there is a high chance of the orange channel to take place. If on the other hand sell off days start to pile in, chances are better for a final top in a week or two.
Jan 21, 2012
Another Climax Run?
The market action has frustrated me for the last two weeks. My analysis of cycles suggested an imminent deeper corrections that has not happened (yet). I believe in times when market seems to oppose logic it is best to try to find a past analogy just to see what can be expected in the near term future. By the way, I've decided to rename my cycles for more clarity. I will name them according to the average length of the cycle. Thus, the 18-day cycle means this is the cycle with an average length of 18 days. For 5-month cycle, average length is 5 months and so on.
So, let's start with the facts that we certainly know. Stock market has been stubbornly griding higher for three weeks without any minor sign of exhaustion. Momentum and money flow indicators go from overbought to more overbought. What can we conclude from this?
The first chart below is from February to May 2010. As we can see conditions back then were pretty similar to today's. The second 18-day cycle out of 5-month cycle bottom was accumulation period when both indicators stayed overbought for a long time. The next cycle was choppier as retails started to chase the rally and smarts selling to them. It all finished with a final blow-off top.
 Next chart is from September to November 2010. A similar story. The first 18-day cycle after significant bottom was accumulation period, followed by two more choppier cycles with shallow corrections.
 Another example is start of 2011. This one was a little bit different. The accumulation period was not so obvious and it stretched into two 18-day cycles. The rest of the story is pretty much the same. Several shallow corrections all being bought until the final climax run.
 Now, let's make some general observations before moving to current conditions. First, notice the obvious separation from accumulation to distribution period. Accumulation period exhibits a very well defined uptrend with almost no pullbacks and all indicators staying in overbougth range for several weeks. During distribution period price action tends to become choppier, momentum line starts to wiggle and MFI barely moves above 80 as every rally is being sold.
Regardless of the cycle count it looks like we have just witnessed accumulation period. Every indicator I look (price/volume, stochastics and MFI) display these properties. Timing wise I am not so sure that 18-day cycle low is already behind us. We are on day 21, which is very late, but the constantly overbought MFI suggests we may still see that 2-3 day pullback before continuation of the uptrend.
Cyclicaly speaking we are in the timing band for a 9-week cycle low and in the timing band for a 18-day cycle low. A 3% drop should probably be enough to satisfy these conditions. On the other hand, the 9-week cycle may easily extend up to 12 weeks, so another 18-day cycle until the 9-week bottom is not out of question. Also, mind that we are officially still in a bear market. The long term 5-month cycle is not so far away and it is simply hard to believe that we may see another month or so of higher prices. But who knows?
 I basically see two possibilites right now. The lenght of this rally and money flow suggest a very strong accumulation that should spurt another powerful push higher. On the other hand the parabolic look of this final week may also mean that we may just witness a couple more days of climax run, followed by a plunge. Although I like to make long term projections my trading decisions are (or at least should be) made based on short term market action. Right now markets are way overbought and even if this rally turns out to be a climax run I have no intention to buy anything until I see at least a 2% correction that would release overbought conditions, confirm my initial view that accumulation period is coming to an end and print a clear cycle low, whether it be just 18-day or 9-week cycle. So, currently I'm in a waiting mode until some high pribability setups present.
Jan 19, 2012
Stock Market's Surprise
Stock market has caught me totally unaware. I certainly did not expect such an extended move to the upside. From technical perspective it seems unrational, but I have to proclaim that one day drop down to the previous consolidation area as a 17 day half-daily cycle low. I could also say that we are on day 19 of an extremely extended cycle, but it is usually better to stick to the normal timing bands and day 17 is much more normal than day 23 or more. So, what can we expect with this new cycle count in place? From the half-daily cycle perspective, the cycle is still young and could rally for two more weeks before bottoming. But the daily cycle is 35 days old and already in stage for a bottom. I simply don't believe we may see much more further upside. Not to mention indicators that have resisted overbought levels since the start of this daily cycle. Furthermore, big volume up days late in the cycle often tend to mark tops. We'll just have to wait for a decline to happen and then see how much of further upside we can expect. As it looks now, decline should be quick and shallow, soon followed by by a higher high.

Let's see how gold is doing. Right now, gold is a laggard. It is making higher highs, but volume and momentum suggest another half-daily cycle decline is imminent. If it bottoms above previous low, I might consider a minor position for a short term trade as volume properties still suggest another higher high.
 I usually don't talk about gold miners, but there is a high probability shorting setup developing. Miners mostly follow gold in cycle count but are also affected by stock market. They are the weakest issue of all three. While gold and stocks are making higher highs, miners are way below. There is strong divergence in both momentum and volume and day to day candlestick analysis also exhibits selling into every strength. Any rally up to 54 mark would provide a very high risk/reward ratio short setup. It may happen during current or the next half-daily cycle.
Jan 16, 2012
Weekly Perspective
I'll make a brief post about my intermediate term projections for stocks and gold. I've made some analysis of past charts and realized that the following months will probably bring us more downside for both issues.
Below is the weekly SPX chart. I've also plotted stochastics and MFI, my new indicators that I use. First thing to notice is the different behavior of both indicators in a healthy bull market in not so healthy bull market. In bull market MFI has a strong upside bias and higher highs and higher lows in index are confirmed by both momentum and volume. Observe that in the past year MFI has been unable to climb into overbought territory. What's more, we are seeing divergence right now, which suggests this cycle might be very close to a top.

We saw a very similar picture in 2008. Suddenly divergences in momentum and volume started to appear and MFI got a negative bias. It wasn't until the first cycle out of final bear market low when MFI went up to 100. Also, pay attention to extremely strong divergence in MFI just before the bottom, even during the strong downside momentum.

2000 to 2003 bear market was not much different. A bear market bottom was indicated by divergence in MFI, followed by an explosive move, that took MFI to 100, which was the first time since the bull market top.

It should be clear by now what I'm pointing too. First, I don't believe we have seen the final bottom. Not by a long shot. Bear market rallies can extend just enough to convince everyone that new bull is just around the corner. Luckily, we can use some volume studies to confirm how much buying was really going on during the rally. As current MFI readings suggest, this rally is fake and should reverse soon. Maybe starting this week.
Second, at the final bear market bottom I expect to see a divergence in MFI. After the final shakeout MFI should get up to 100 in no more than four weeks, which would be our final confirmation. Until I see these signs, I'll be very, very sceptical of buying at the long side.
Let's make the same analysis for gold. We have just witnessed the first weekly cycle in three years that was unable to push MFI above 80. What's more, selling volume seems to be increasing, which is seen from the downtrend on MFI. Plain and simple, I don't believe we have seen the bottom of this correction yet. I expect a strong move to the downside that will push MFI down to zero (and fix it there for some time), followed by a rally and hopefully a double bottom with MFI divergence. Previous cycle was very short (13 weeks), so this cycle could maybe extend up to 25 or 30, thus having enough time to complete the abovementioned scenario. Furthermore, if all this happens close to the pink line, this would be the final clue of another bull cycle starting.

Jan 15, 2012
Trade Review: ALXN, CBLI, HGSI, VPHM, NSR
I made plenty of trades this week. Probably a bit too many. My losing streak made me to become even more careful with my trades. I decided I will start taking smaller positions, not risking more than $100 on any trade, preferrably even less. And second, I'll start monitoring markets even closer as there are obviously only brief moments of momentum when swing trading has risk reward ratio high enough. Consequently, I was loaded in five positions when I realized that markets may be ready for a correction. I got scared of further losses and sold them all on January 9. Markets eventually rallied, but most of my stocks basically went nowhere or fall after I sold them, so I was at least able to finish one week positive after several negative weeks.
I'm not going to spend any time on discussing every single trade this week as all charts are well annotated. Probably the lesson from the past several trades should be that I should strictly focus on the best longer term patterns as these seem to have the highest breakout probability in this market. Also, simply taking profits in 5 to 10% range may not be a bad idea as most breakouts simply fail soon after they make some initial progress.
ALXN: +7%/+$250

CBLI: +7.1%/+$96

HGSI: +5.8%/+$68

VPHM: -1.7%/-$24

NSR: -1%/-$28

Jan 13, 2012
Conditions Improving
Stock market did not provide a decline into the half-daily cycle low as I suspected last week. Instead it stubbornly flirts with the 1300 mark on SPX in an extended half daily cycle. What's more, yesterday SPX made a new weely cyle high, which makes it for at least 16 week top. What this means for the remaining of this bear market remains to be seen as the decline into the next weekly low develops.
Anyway, the current haly-daily cycle is on day 16 and daily cycle on day 32. Both cycles are due for a decline in the next 5 to 8 trading days. I started to incorporate some indicators into my tarding arsenal. I've been studying several over past month or so and found stochastic(5) to be the most reliable momentum oscilator and Money Flow Index MFI(5) as the most reliable accumulation/distribution indicator. Both are just screaming for a decline. In fact, I haven't seen MFI so strongly overbought since the last bull market. A correction is due, but both indicators show strength in the market. Decline might materialize only as a 2-3 day swift drop and then quickly reach new highs. The next weekly low is still at least a month away, so there is plenty of time for another new highs attempt. However, I definitely don't want to buy anything right now. Stock market will correct very soon and shake out many week hands who are buying these "breakouts".

Now on to gold. I use the exact same indicators. Gold also exhibits strength. The half-daily cycle, that usually takes 7 to 9 days, bottomed surprisingly in just six days and and gold is now flirting with 1675 resistance. It wont be breached in the first attempt, I'm almost sure about that. I expect gold will decline in the daily low sometimes in early February within the next two half-daily cycles and everything suggests it should make a significant higher high. I plan to buy the next daily low for a short term trade if MFI bottoms above 20, which would mean a lack of distribuion. However, the next daily low after this should also be a weekly low, which means that gold will probably come down to retest the 1525 area. The next weekly low should also provide the best long term buying opportunity of this bull cycle for another couple of years.

Jan 9, 2012
Cycles Theory
My recent trade reviews took me a lot of time, so I haven't been able to make a decent post about the stock market and gold. I think it's time to look at where we are at the moment. I started to implement a cycle theory into my trading, so I'll devote this post to short term cycles in stocks and gold.
On SPX chart below I've marked the daily cycle lows (blue arrow) since the last weekly cycle low (black arrow) and half-daily cycle lows (green arrow) from the last daily cycle low. The usual timing band for the shortest cycle I follow, which is what I call a half-daily cycle, is around 15 days. The current HD cycle is 13 days old and should find a bottom sometimes this week. The current daily cylcle (D) is 29 days old and should find a bottom within its normal timing band between 35 and 45 days. The weekly cycle (W) is 13 weeks old and still has plenty of time to develop as W cycles tend to last from 20 to 25 weeks on average.
 My expectation for this week is that stock market will make a swift two to three day drop. How deep will it go is impossible to predict. I guess somewhere between 1225 and 1250 would be a nice level for a bottom. The bottom of the next HD cycle will also coincide with the bottom of the next D cycle, which means that the correction will be deeper. I expect the next HD cycle will top in no more than 6 days and it will not go above highs of the current HD cycle. I also expect the next D cycle will bottom above the bottom of the previous daily cycle as we now have two consecutive HD cycles with higher highs, so there is plenty of support below.
Now, the most important question is whether current weekly cycle has already topped on week 4 at about 1290 level. I think it has. Reasons why I think so are following. First, we are in a bear market. In bear markets weekly cycles tend to top in the first 8 weeks. A later than 15 week top seems almost impossible to me. Second, volume properties simply don't suggest any major accumulation. D and HD corrections are deep, which is not typical for weekly cycles that want to reach new highs. We'll talk about this when current cycle develops a little further.
And now to gold. The biggest question is of course whether gold has already formed long term bottom. I think not. The main reasons are two. First, gold W cycles usually last between 15 and 20 weeks. Previous cycle was 13 weeks long and if current W cycle already bottomed, it should be 13 weeks long also. Two very short cycles in a row are unlikely. Second, the rally out of W cycle should be furious. The current HD cycle we are seeing right now is on low volume and it looks like it already topped on day five, which is also not positive. I think we will see at least two more D cycles before this W cycle finally bottoms. I expect this will happen sometimes in late February or early March.
 I know these are pretty bold predictions. I'm actually not too concerned with long term weekly cycles. Daily and half-daily cycles are useful for timing trades. I'm looking to go short both stocks and gold as soon as we get a confirmation that both still have weekly cycle lows to print.
Jan 8, 2012
Trade Review: SCSS, AMRS
Another disappointing week. I closed two trades and both of them negative. The first one is SCSS, which broke out from a nine week basing Breakthru pattern. There's not much I could say about this trade as the picture says it all. I bought a breakout above clearly defined buy point. Price made an intraday reversal, shook me out the next day and then rallied. A very painfull experience. One thing I learned from this one is that I really, really, REALLY have to set my stops a little wider. I did put it below the day of the breakout as I simply couldn't believe that such a strong breakout could reverse. But it did. A stop should've been set at least below the previous day low.
 The next trade is even more confusing. AMRS made something that I call a Bottom pattern. As seen from the chart, the neckline (buy point) was clear, stock was obviously under accumulation and so I had to buy that breakout. It closed well for the first day and I expected at least some follow through up to 13 level. But the stock then simply collapsed. There is virtually nothing I could reproach to myself with this one. Except for one thing, which I'll explain in a minute.
 These two losing trades from seemingly well defined patterns and well executed buys forced me to rethink my strategy a little bit. I mean, if good patterns with good buy points and well set stops don't work, what will work then?? I found my answer in the current market environment. Please see the chart below. I've plotted Nasdaq chart with a Dow Jones index line in the background. It is clear that market is obviously being dragged up by only a handful of large cap stocks included in Dow Jones. When Dow leads this is not a time for momentum trades. I mainly trade small cap stocks that experience some momentum, but there is just not any momentum in this market.
And the second mistake is something I've already made in the past. I tried to buy breakouts on a big gap up day on indexes. My experience tells me that gap ups in a short term uptrend usually mean a short term top as many traders sell into these gaps. But still, I was ready to forget this experience and buy. It cost me, but the lesson was here.
 I've also come to a conclusion that something is missing in my market direction/timing system. It is the obvious fact that market moves in cycles. I constantly look for confirmations of trend reversals before buying and this strategy constantly forces me to chase the market. The first task for the new year is so to determine some sort of cyclical timing tool both for stocks and gold. If I have time later in the day I'll try to explain why I think everything is now set for the decline in the stock market. Which makes me a little bit nervous as I still hold a handful of positions. Any strength on Monday will be sold.
Subscribe to:
Posts (Atom)